 amniskin
The scenario:
$n$ people are in line ready to board a full plane (so $n$ people in $n$ seats). The first person in line lost his boarding pass, so he just sits in any random old seat (but specifically not his own). From then on, the people boarding are so nice that they won’t confront someone sitting in their respective seats; instead, they’ll just take a random empty one. What’s the probability that the last person gets to sit in his or her own seat?
What you know:
- There are $n$ seats on the plane
- There are $n$ passengers about to board the plane
- The first passenger sits in the wrong seat
- Every passenger after sits in his/her own seat if it’s available
- Every passenger sits in a random available seat if his/her seat is not available.
You need to find out what the probability that the last person gets to sit in his/her own seat.
Hints (click to unblur)
-
It might be best to start with the base case ($n$ = 3)
-
What if the first person sat in a totally random seat (instead of specifically not his own)?
A solution
A description
if $n > 2$, then
\[\mathbb{P}\left(\cdot | n\right) = \frac{1}{2}\]If $n = 2$, then $\mathbb{P}\left(\cdot | 2\right) = 0$.
The explanation
Firstly, if $n = 1$, the game is ill defined, if $n=2$, the probability is 0 (because the first person always takes the wrong seat). If $n>2$, then at every point the choices are,
- Sit in the first person’s seat thereby closing the book on this whole debacle, assuring the vacancy of the posterior protector for our helpless late-boarder.
- They sit in the last person’s seat, thereby ensuring their own place in hell along with our hero’s long lost comfort that only comes from sitting in your very own assigned seat.
- Or they sit in someone else’s seat, thereby passing the buck on to someone else and not changing the results at all.
So it’s either 50/50, or it’s postponed with the same choices later. So it’s 50/50 in the end.
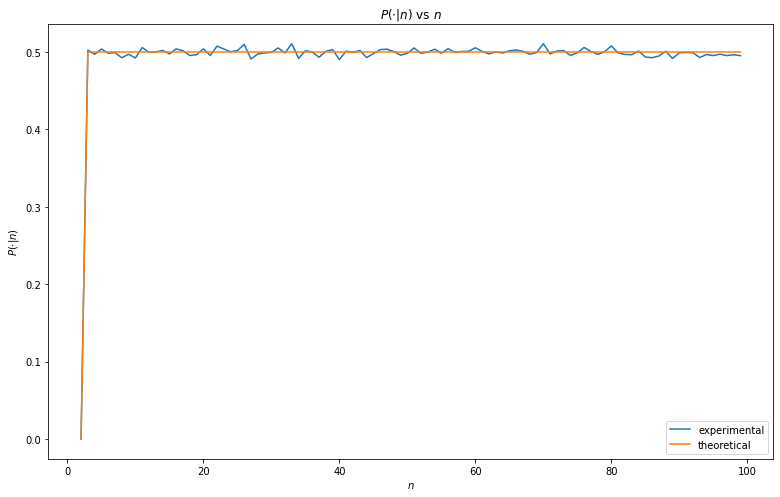
The experiment
I essentially played this game 10,000 times for each $n$ between 2 and 100, then plotted the mean for a particular $n$ vs that $n$, along with our theoretical value derived kinda loosely above.
import pandas as pd
import numpy as np
import matplotlib.pyplot as plt
from numba import jit, prange
np.random.seed(1234)

@jit("int8(int16)", nopython=True)
def play(n):
    for i in range(n - 1, 1, -1):
        new = np.random.randint(0, i)
        if new == i - 1:
            return 1
        elif new == 0:
            return 0
    return 0

@jit("float32(int16,int32)")
def play_n(n, b):
    running_sum = 0
    running_num = 0
    for _ in prange(b):
        running_sum = running_sum + play(n)
        running_num += 1
    return float(running_sum / running_num)

result = {i: play_n(i, 10000) for i in range(2, 100)}
df = pd.DataFrame({'experimental': pd.Series(result)})

df['theoretical'] = pd.Series({k: 1/2 if k > 2 else 0 for k in df.index})

plt.figure(figsize=(13,8))
df.plot(ax=plt.gca(), title='$P(\cdot | n)$ vs $n$')
plt.xlabel('$n$')
plt.ylabel('$P(\cdot | n)$');
Download the notebook here.